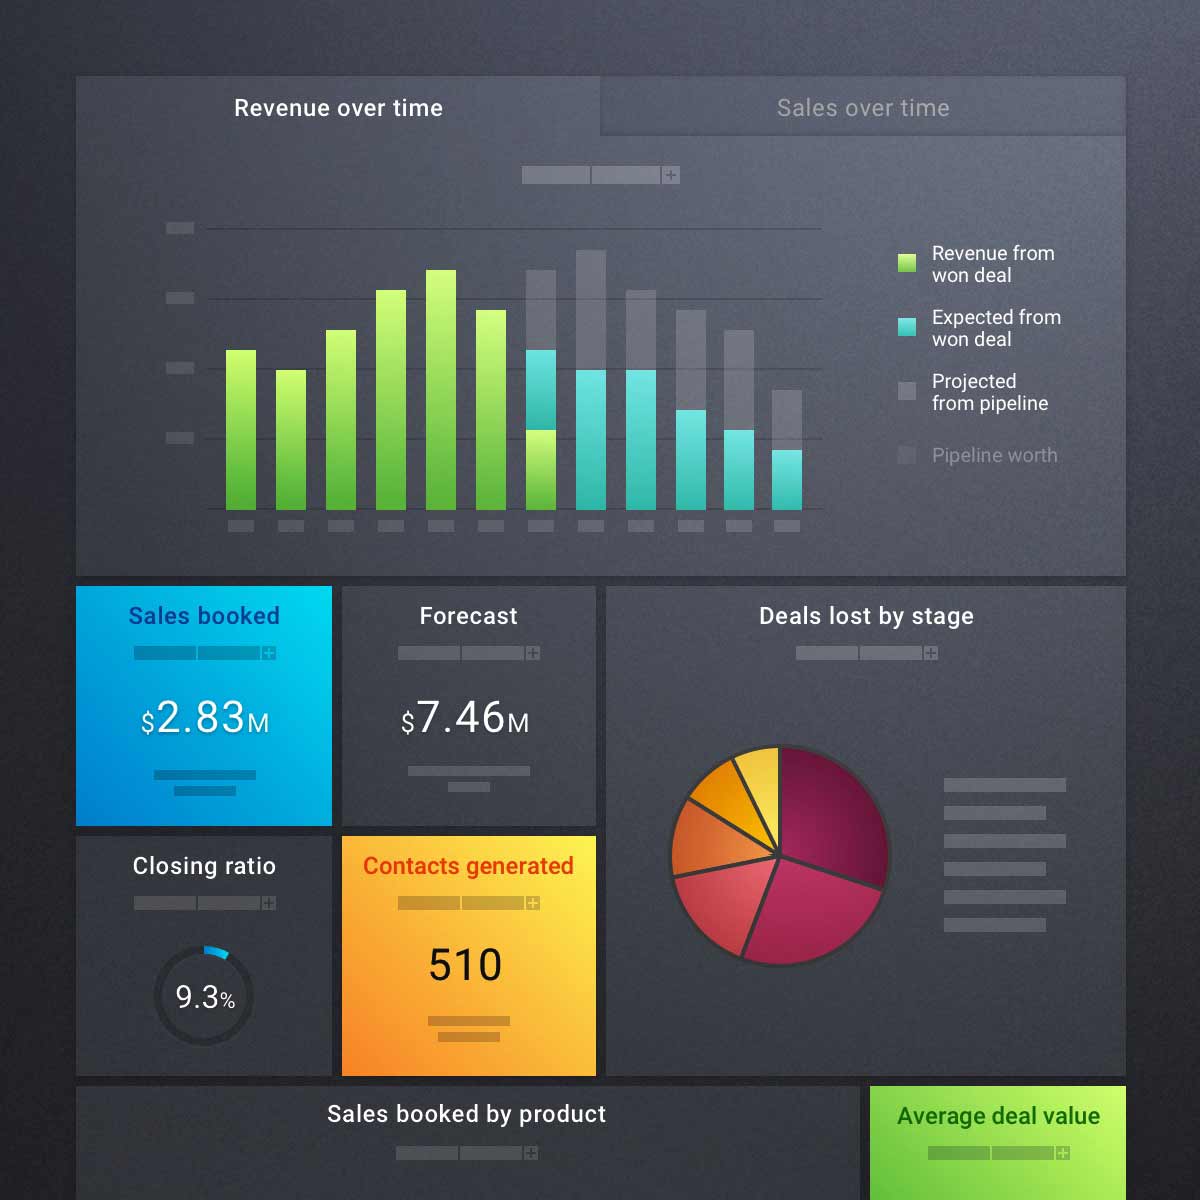
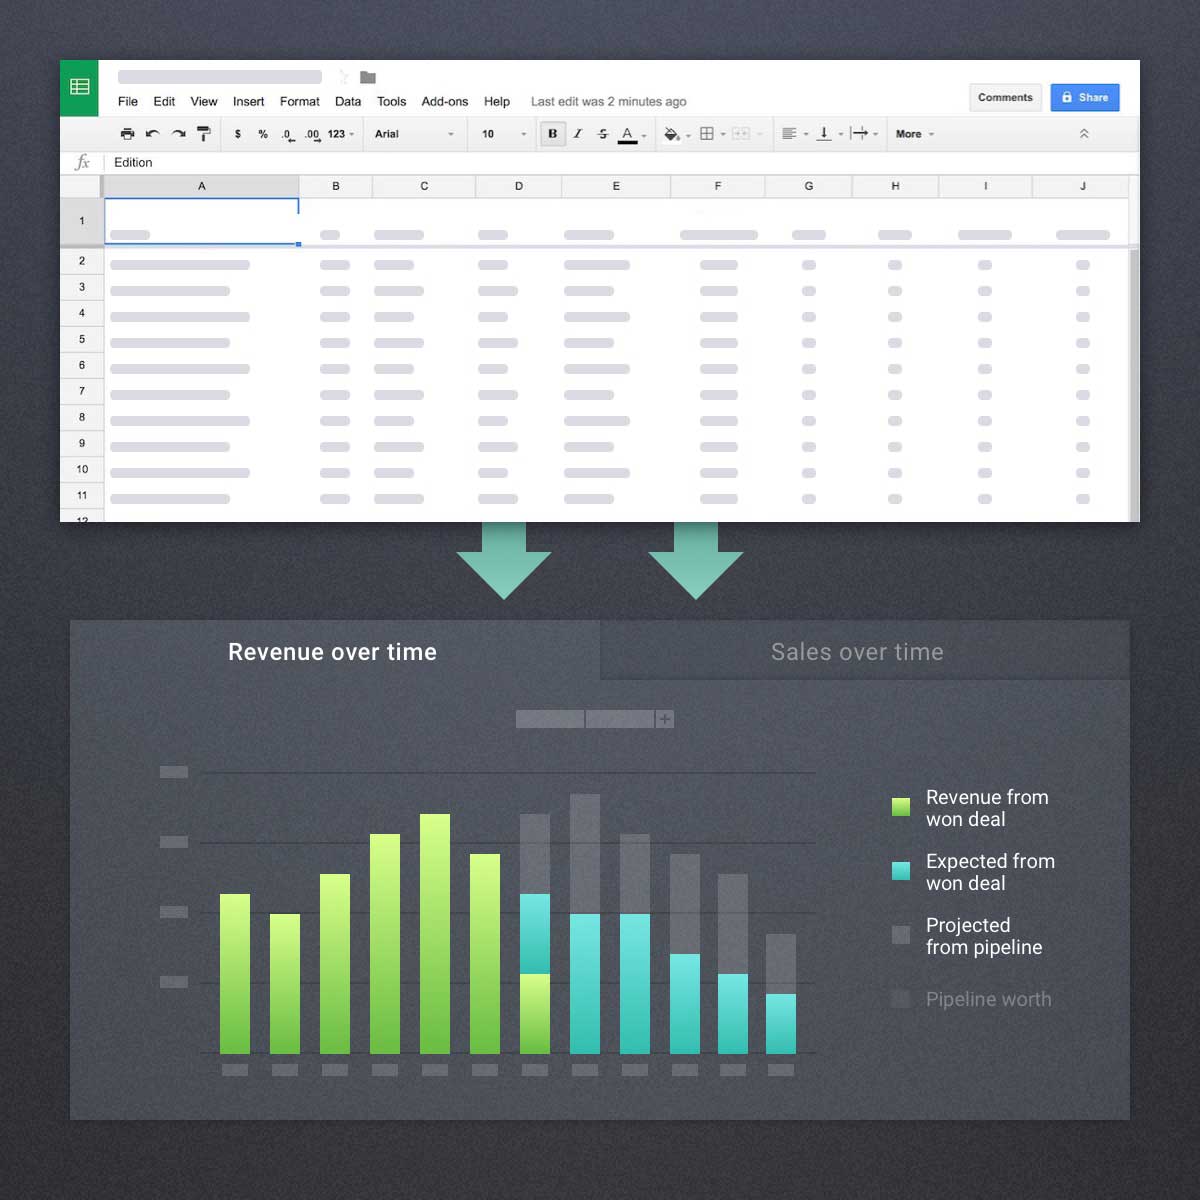
Take Data-driven
business decisions
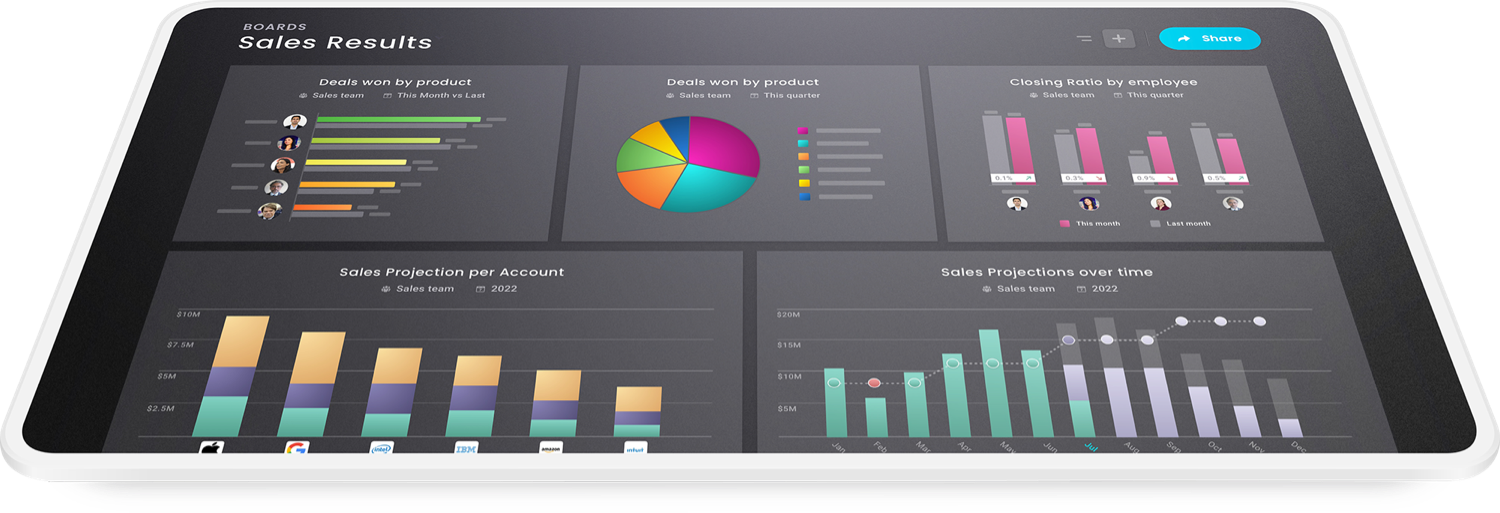
As the central place of your sales activity, UPilot tells you in real-time all the insights you need to analyze, anticipate and take actions.
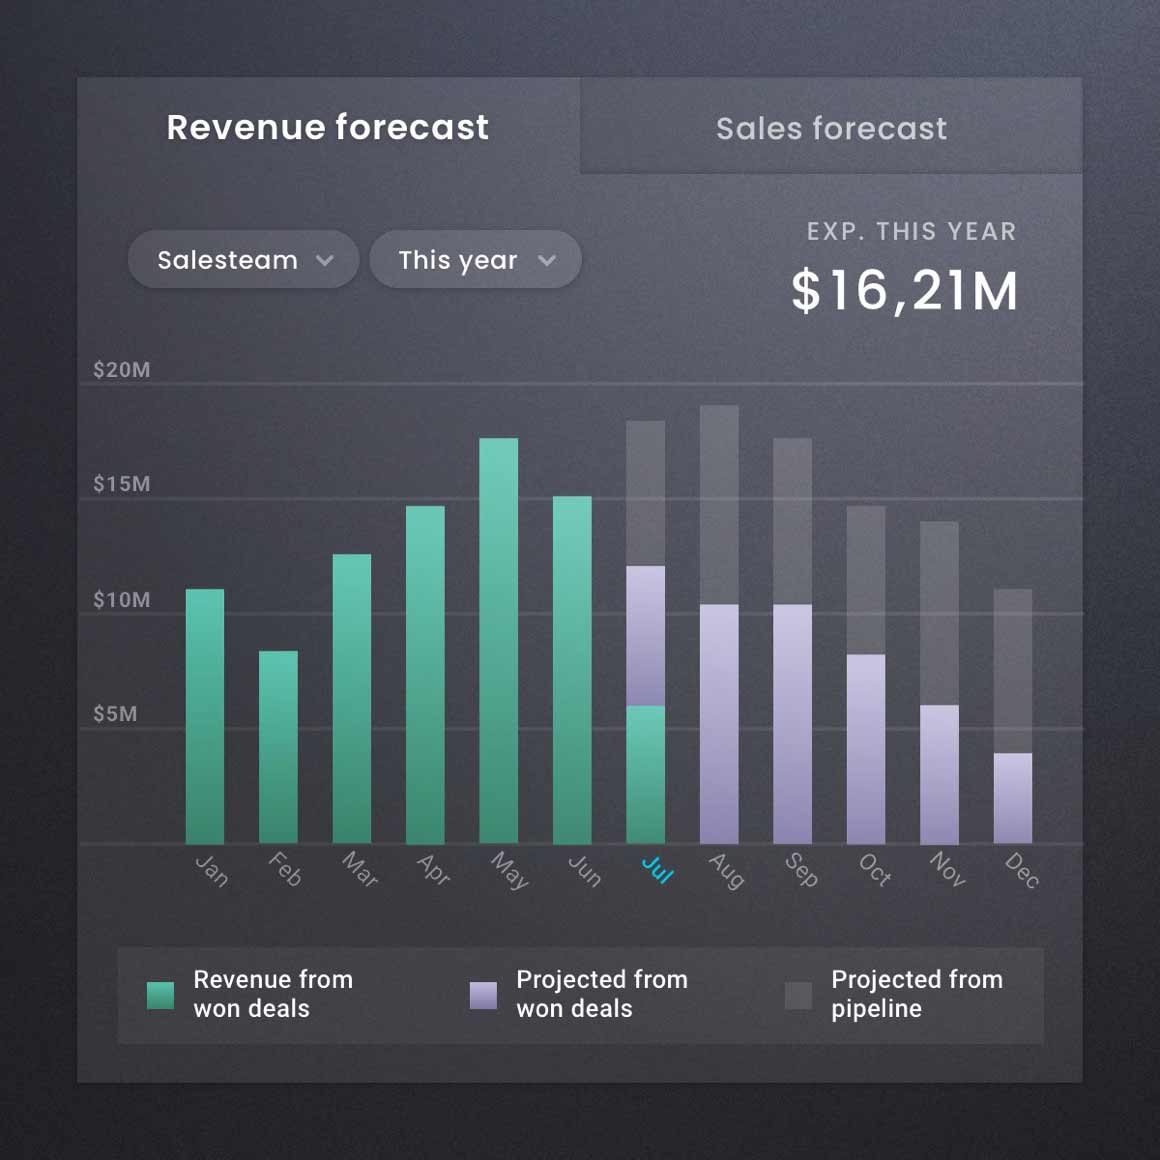
Instant Sales & Revenue Projections
- Total revenue projection by month
- Value of deals closing by month
- Weighted Revenue over Time vs Targets
- Unweighted Revenue over Time vs Targets
- Total projection by salesperson by month
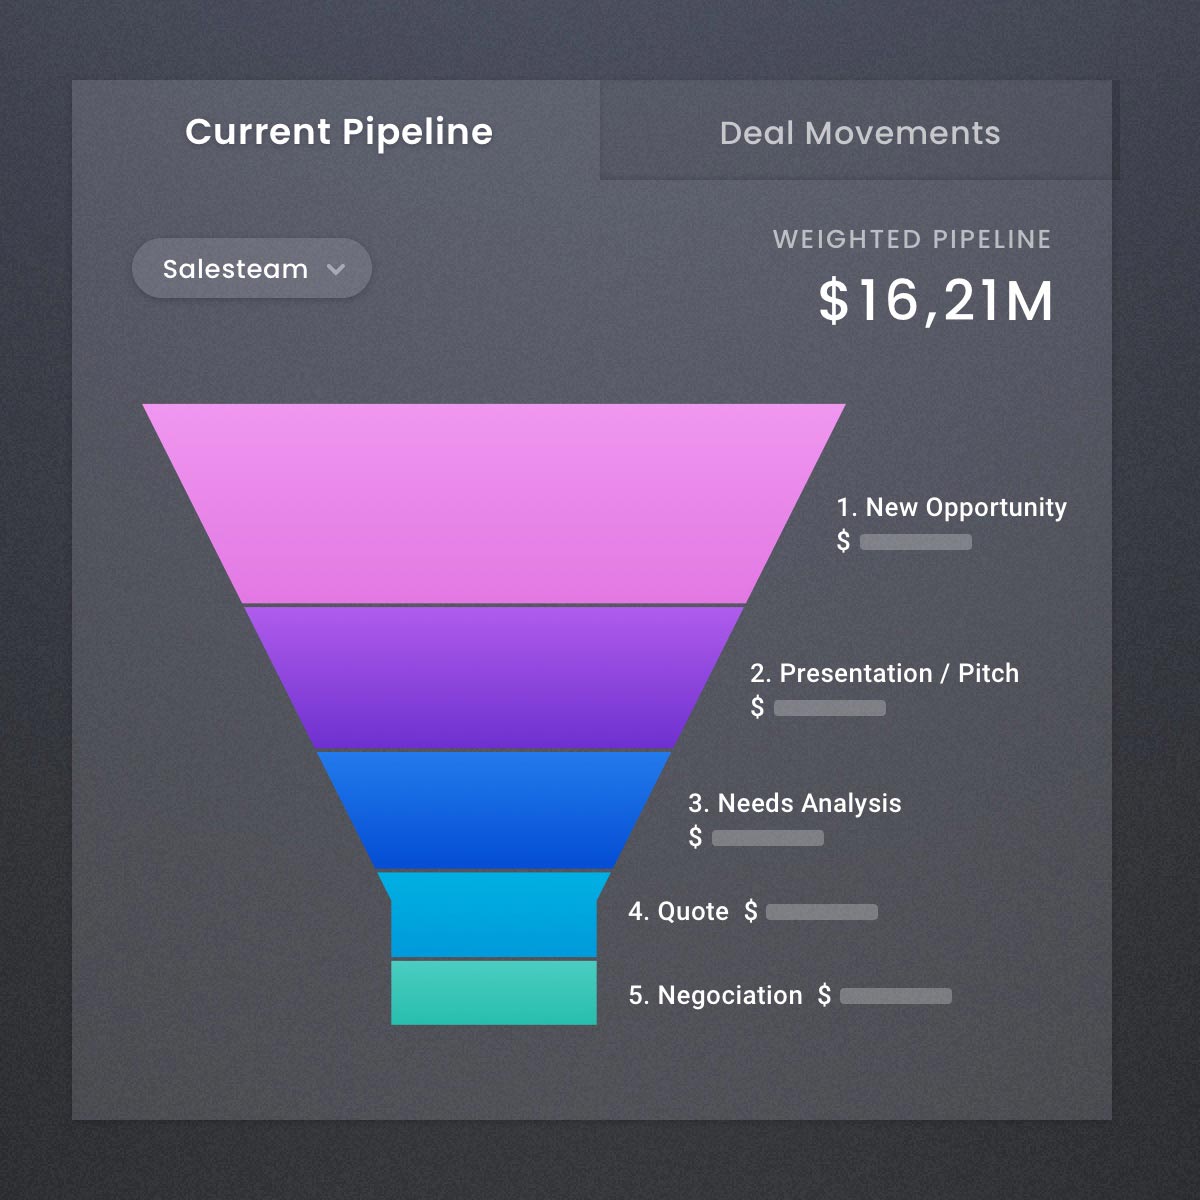
Pipeline Analysis
- Pipeline change by week by sales person
- Pipeline number of deals by stage weekly progress
- Expected revenue by sales person
- Unweighted pipeline by month
- Pipeline lost by month
- Weighted pipeline by client
Sales & Deals Analysis
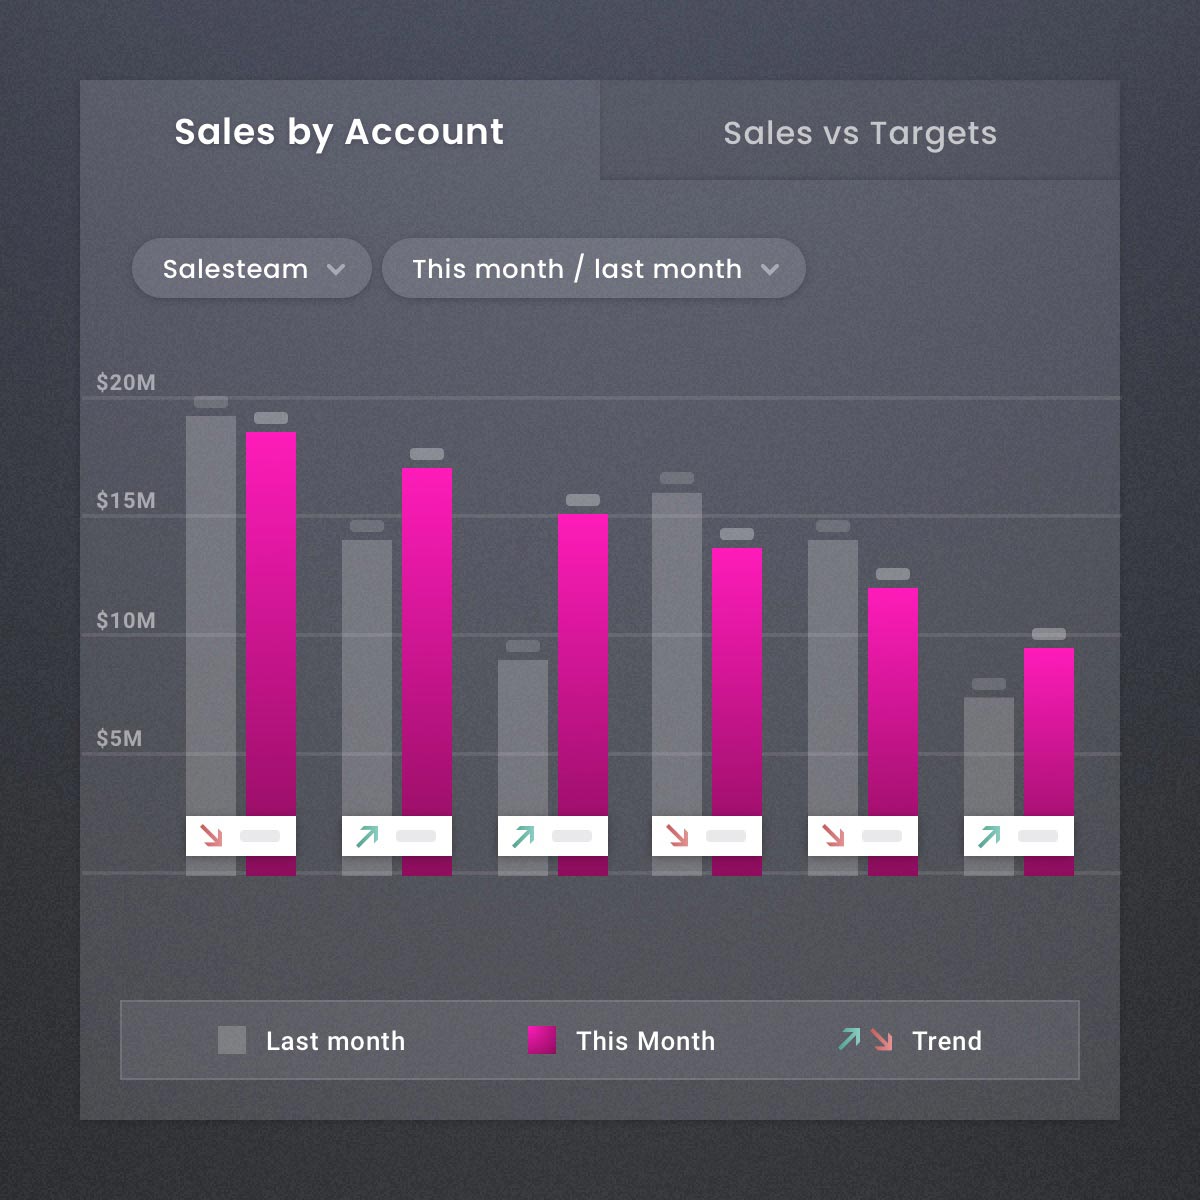
- Weekly/Monthly/Quarterly Sales vs Targets
- Sales by Account
- Sales by Category
- Average Deal Size by Sales person
- Deals won by Sales Rep over time
- Deals lost by Sales Rep over time
- Closing Ratio by Sales Rep over time

Activity & Tasks Analysis
- Task type by person over time
- Number of tasks done by Rep over time
- Planned Tasks by Week
- Tasks Planned vs Tasks Done
For us, it’s really useful to have these reports related to our campaigns to make the information more accessible to our sales team.”
